TODO - add table of contents
overview
I reached out to a friend 4 years back with the intent of starting a blog to answer questions like: ‘do Bollinger bands work?’ and ‘does the ‘golden cross / death cross’ hold true?’ It morphed into an investment club, which turned into group meeting every Tuesday to build models to try and predict the stock market - yeah, yeah, yeah; we drank the Kool-Aid, but you know what? It tasted good.
Eventually I ended up getting my series 65 and started a proper investment company, IMPACT Group. Two of the guys I met with were groomsmen in my wedding, so despite not finding a mathematical formula to mint money, the adventure was worth the time spent.
While initial performance trading via robinhood was better than average, transaction fees ate away profits when executing via Interactive brokers. Currently we are transitioning IMPACT Group into an online portfolio marketplace where people can (1) easily access unique financial products (2) at the lowest cost and (3) feel good about not only where, but with whom, they are investing in.
UPDATE 2020-01-29 - Impact Group is still a licensed investment advisory firm (CRD 300148) and I a licensed Investment Advisor. While we returned our clients a profit, I do not believe we added enough value to warrent pursuing more funding and are not seeking any additional investments as a result. I will be refocusing my time on efforts I believe to be more valuable to future clients and society at large. Stay tuned…
architecture design
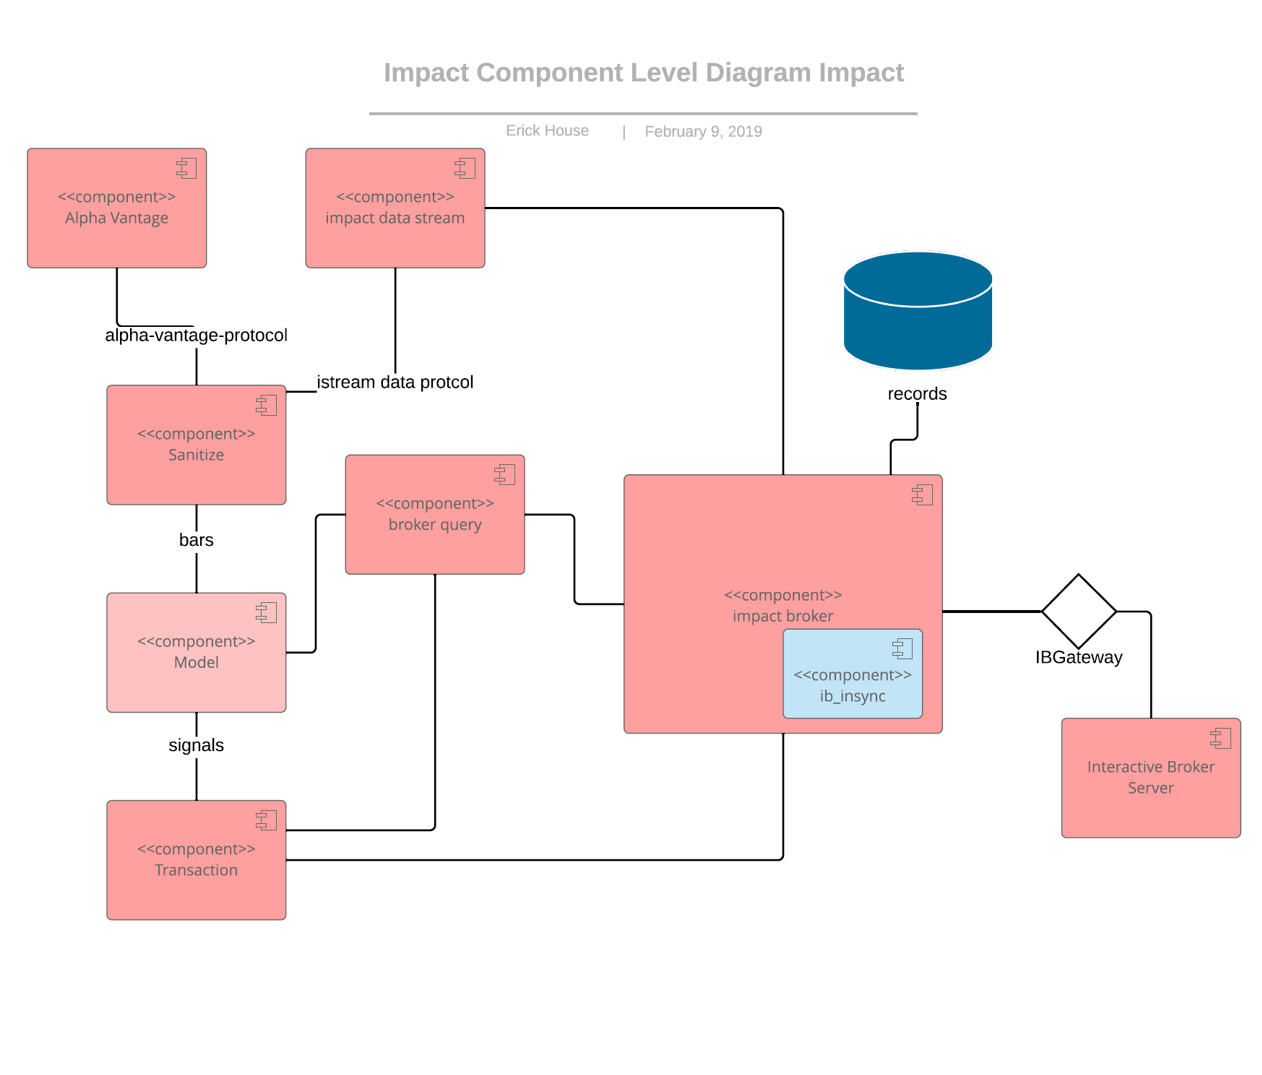
phase 1 component diagram
Credit to Erick House
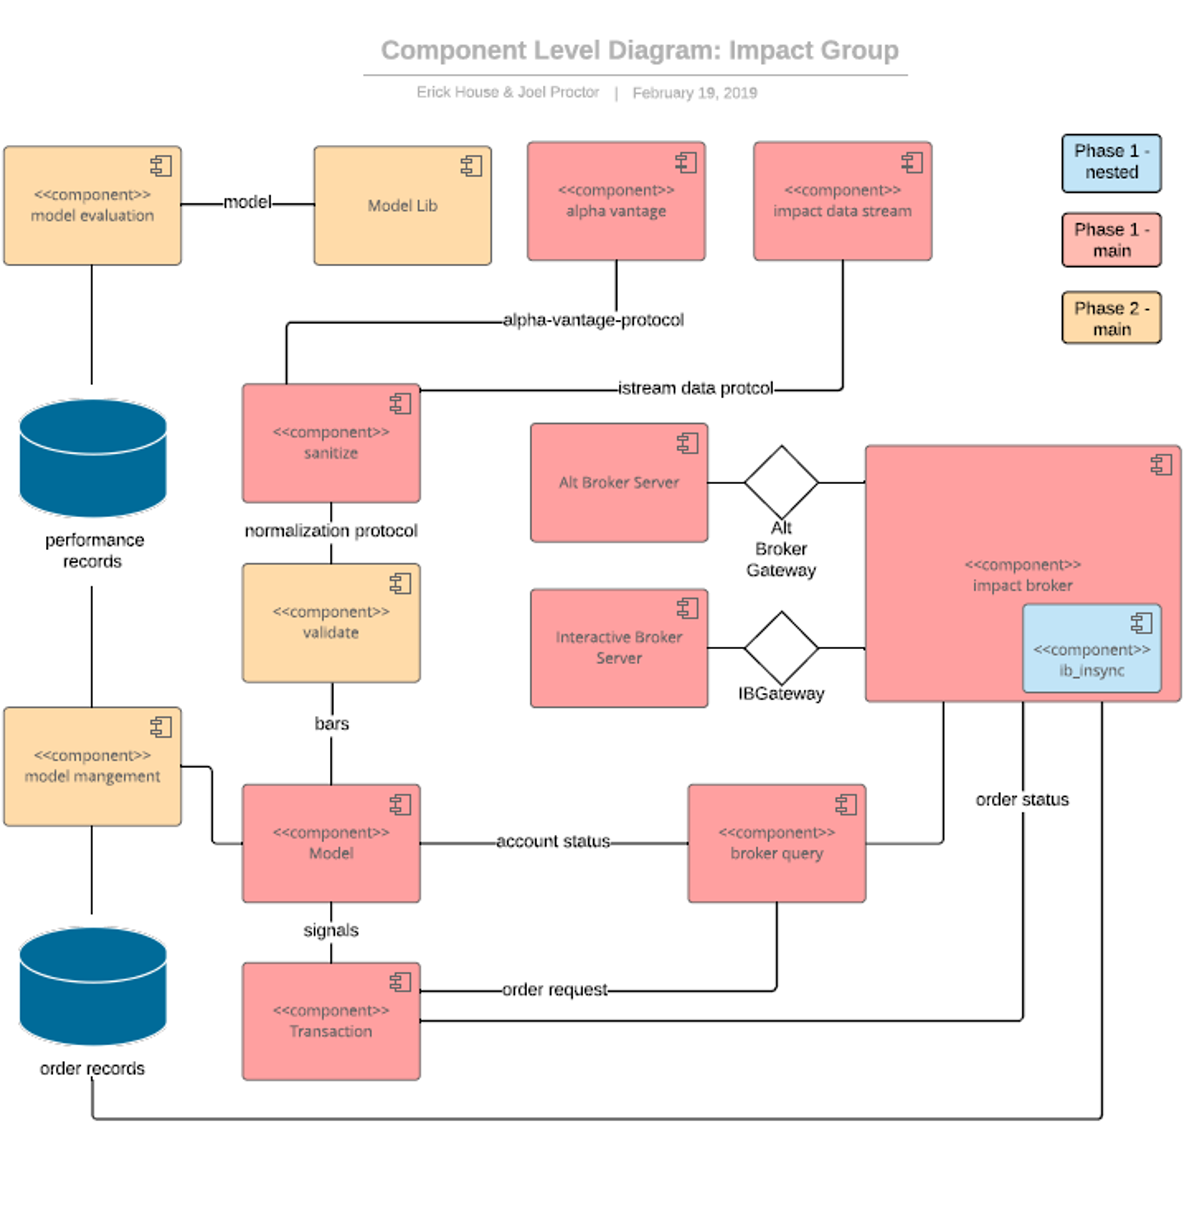
phase 2 component diagram
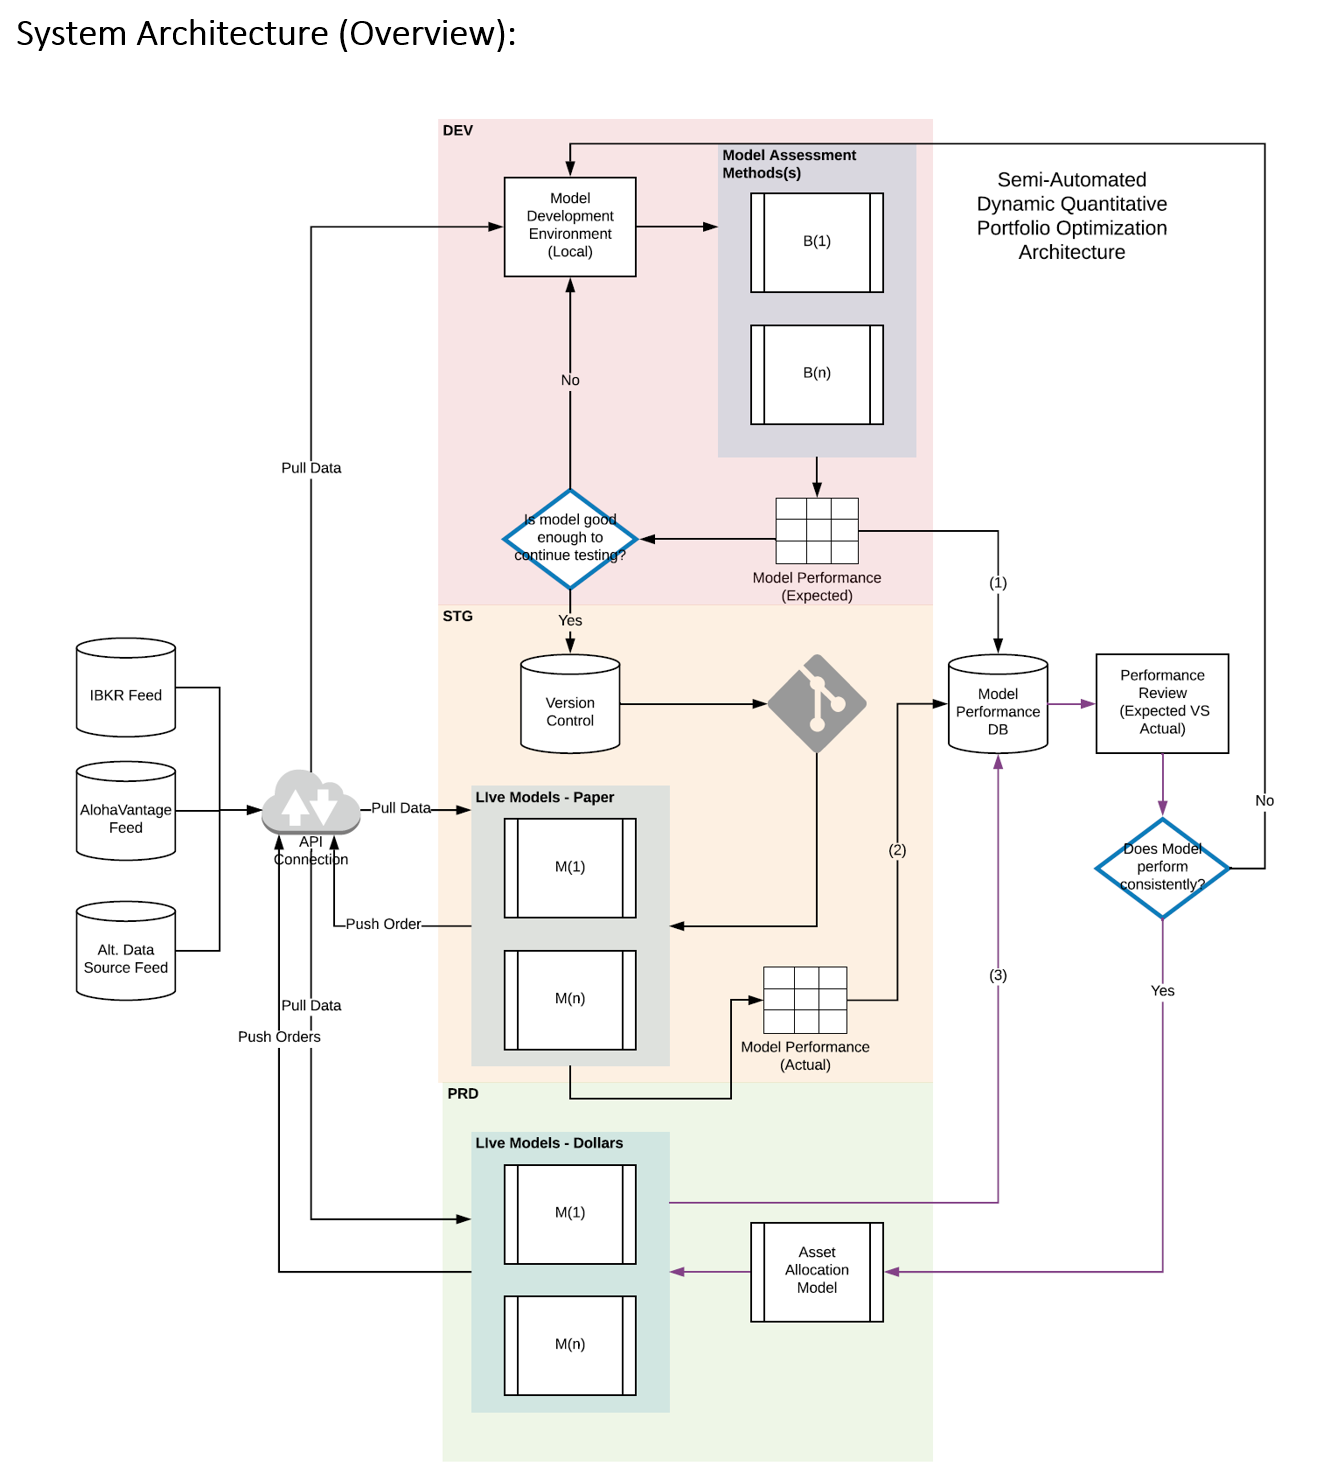
high level solution architecture
performance measurement
Metrics Used to determine whether or not the model is a fit for the specific investor / agency
- total return
- drawdown
- conditional value at risk (shortfall)
- low-beta-to-broad market benchmark (models should have a low correlation to the overall market)
- sharpe ratio
- volatility (standard deviation)
- volatility should track to expected value’s volatility
- turn-over ratios
- should track to expected values
- order timing (time from order placed -> order executed)
- root symbol analysis
- return per ticker
- trade count per ticker
- position concentrations
Sample metric problem scenarios NOTE initial data for the purposed of this demonstration was pulled from robinhood and visualized in excel. while tableau or pbi would have been nice, it seemed like overkill as live connections were not supported. package used has been deprecated.
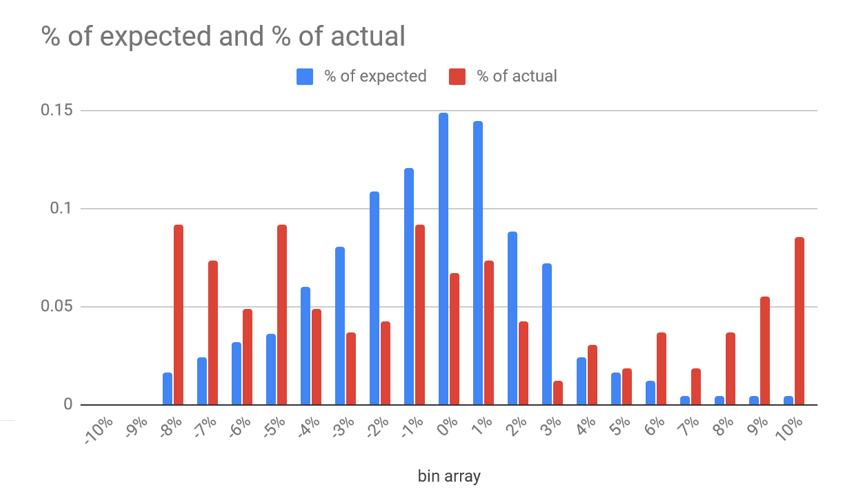
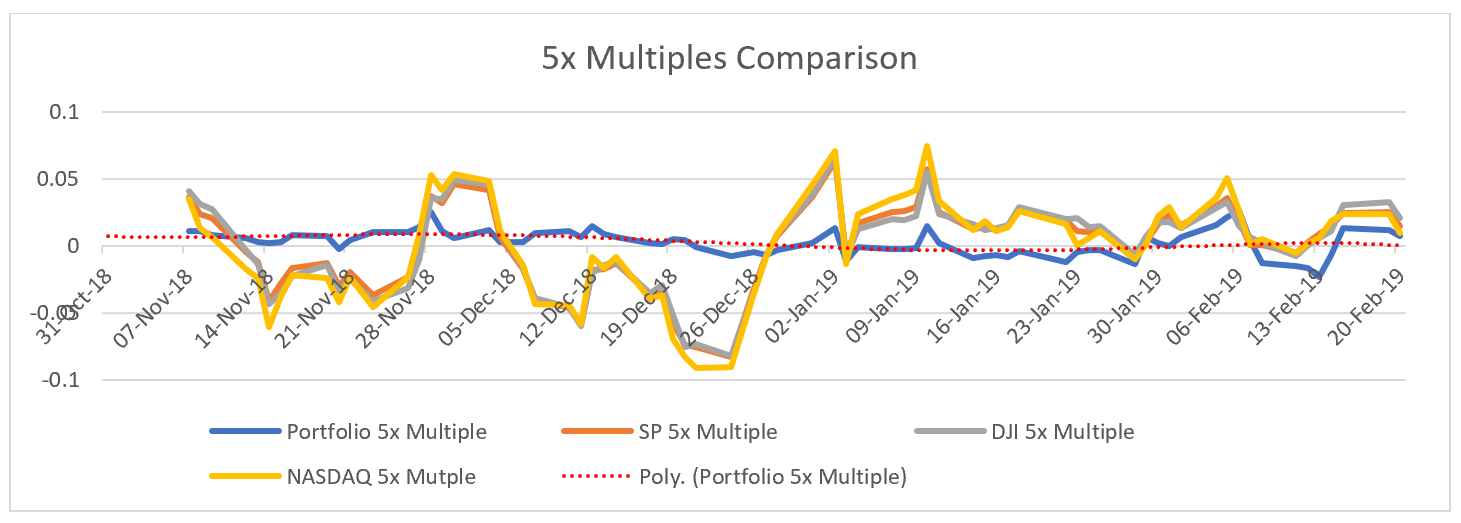
Problem 1 - high probability of aggregate model return similarity prevents model library prioritization Solution - map expected average return per trade, generated via backtest, against actual average return per trade in rolling time periods. Outcome determines whether or not trades, despite average returns, are executing as expected
Problem 2a -how are daily returns comparing to benchmarks (both derivative and non) Solution - daily returns over time (rolling time periods, daily, additional periods determined via trade frequency)
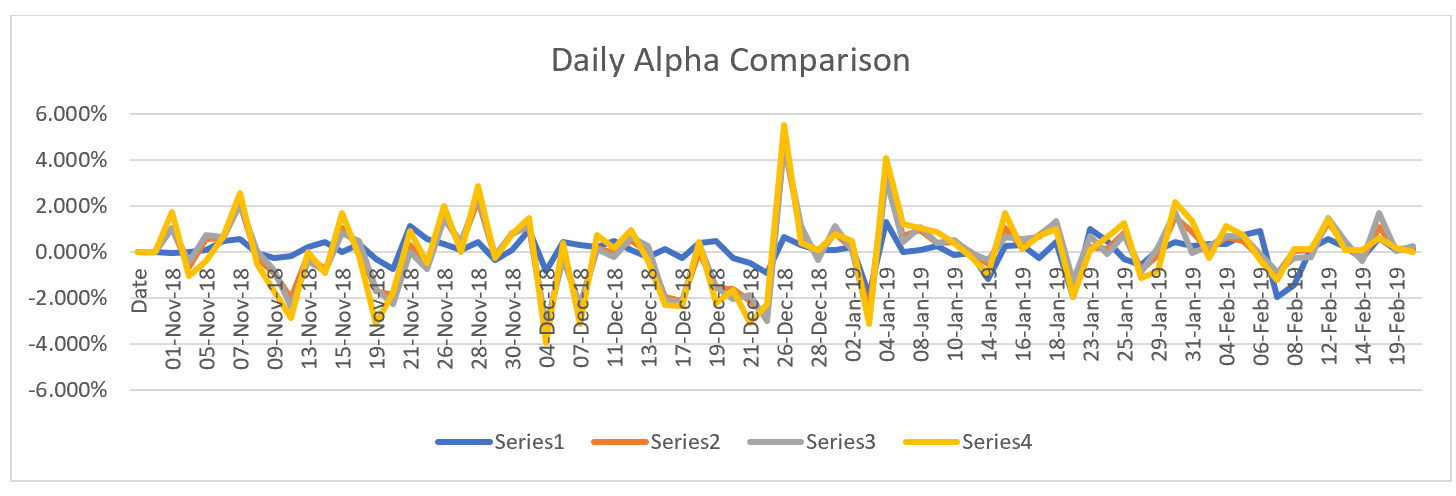
Problem 2b - how are period returns comparing to benchmarks (both derivative and non) Solution - daily returns over time (rolling time periods, daily, additional periods determined via trade frequency)
Problem 3 - rank based on total return
Solution - aggregate returns over time
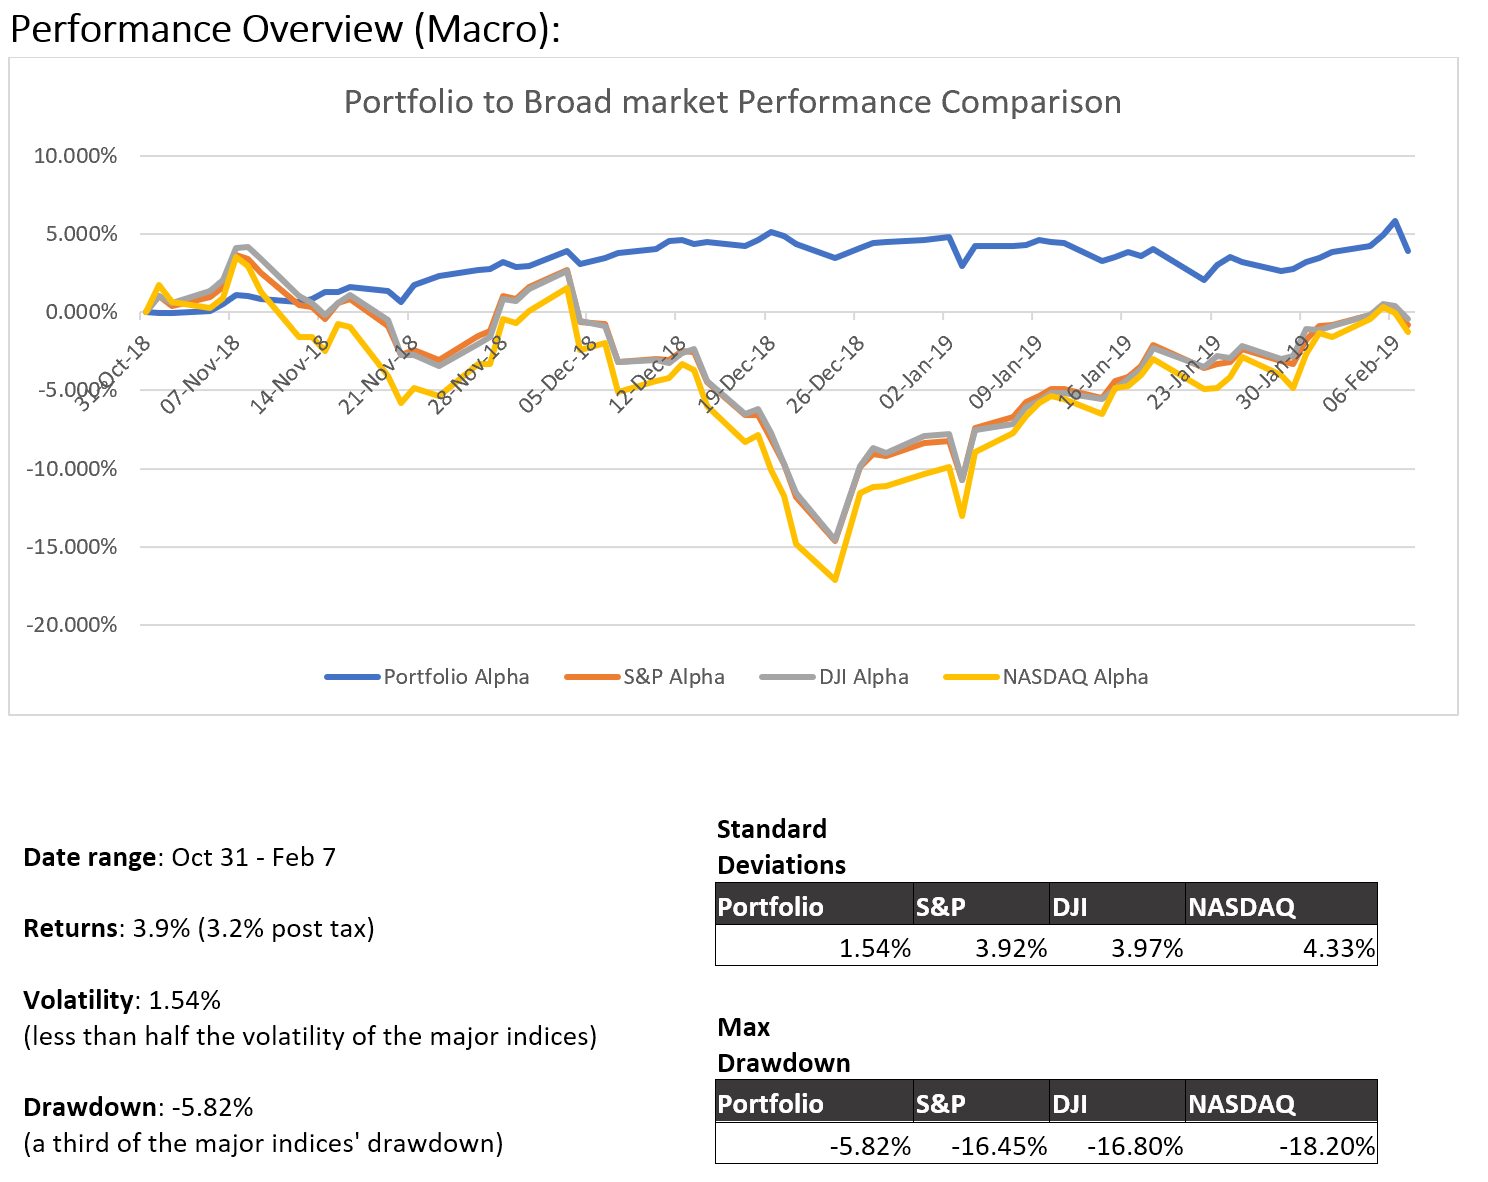
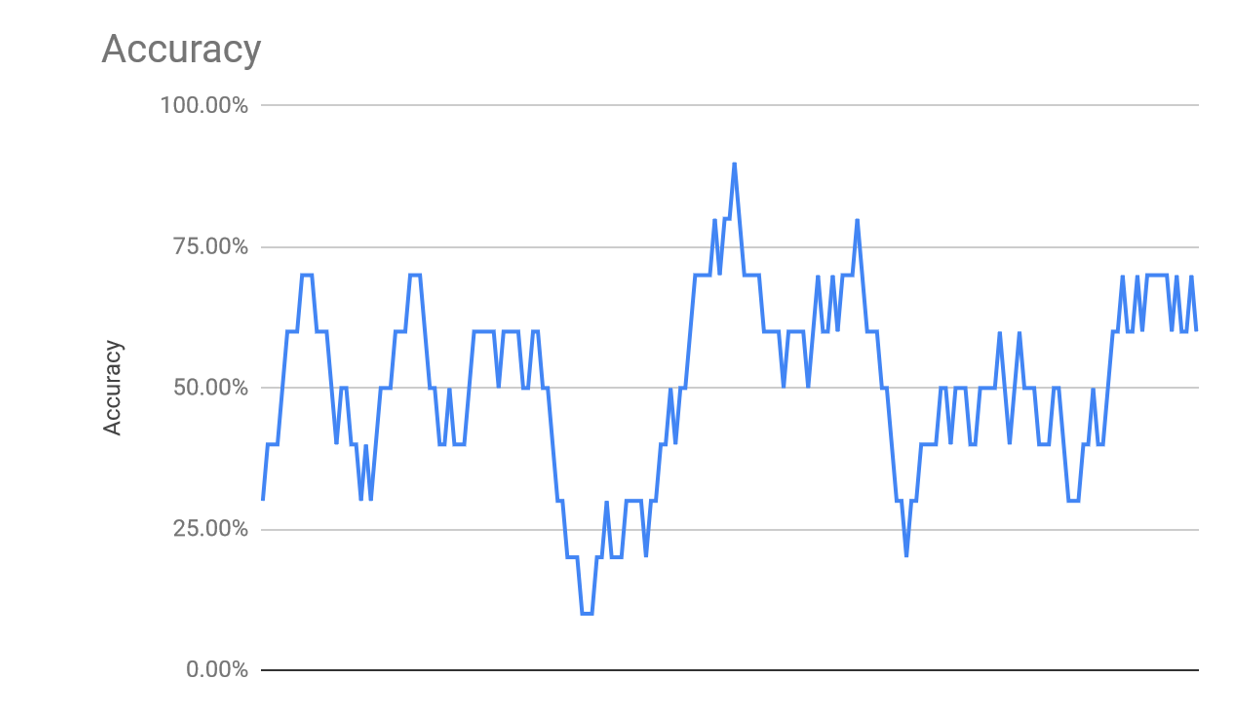
Problem 4 - how accurate is your model trending
Solution - % of total trades positive vs negative, rolling period based on trade frequency
industry takeaways & factoids:
-
Asset managers offer peace of mind, but very little monetary value to client’s lives – performance over time is similar between firms and does not justify exorbitant fees. As a result, fees are under pressure and have been declining. When asking prospective clients (n=17) what they cared about most in an asset manager, responses seldom varied: “more or less I just want to make sure [my portfolio] is going up”, “I don’t really care, as long as my money is safe.”, “I enjoy managing my money, I just don’t have the time”. If a platform can offer the same piece of mind, we can reduce management expenses across the board
-
Asset managers (including robo advisors) are passive indexers – this means all in management costs need to be calculated when picking the right manager or advisor
-
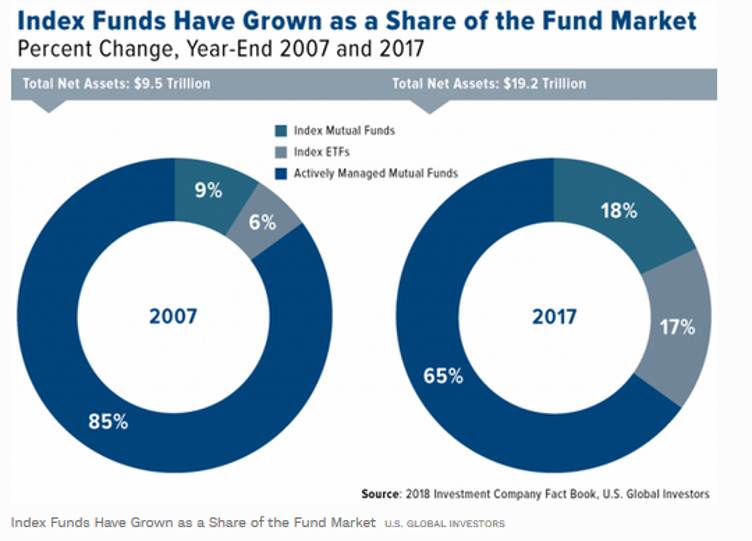
Mutual funds are a thing of the past – The rise of ETFs and high comparative fees are primary factors in their decline… I believe the only reason they still exist is because of institutional and governmental (401k, pension, etc) control on retirement funds. I would have liquidated my 401k years ago and managed it myself, had it not been for the fees associated.
-
Tax loss harvesting methodology needs an upgrade and should be accessible to all – The current sophistication of the tax loss harvesting (TLH) solutions on the market is minimal. Wealthfront offers TLH on an individual stock level, but this could easily be replicated if other advisors thought it to be a valuable differentiator.
-
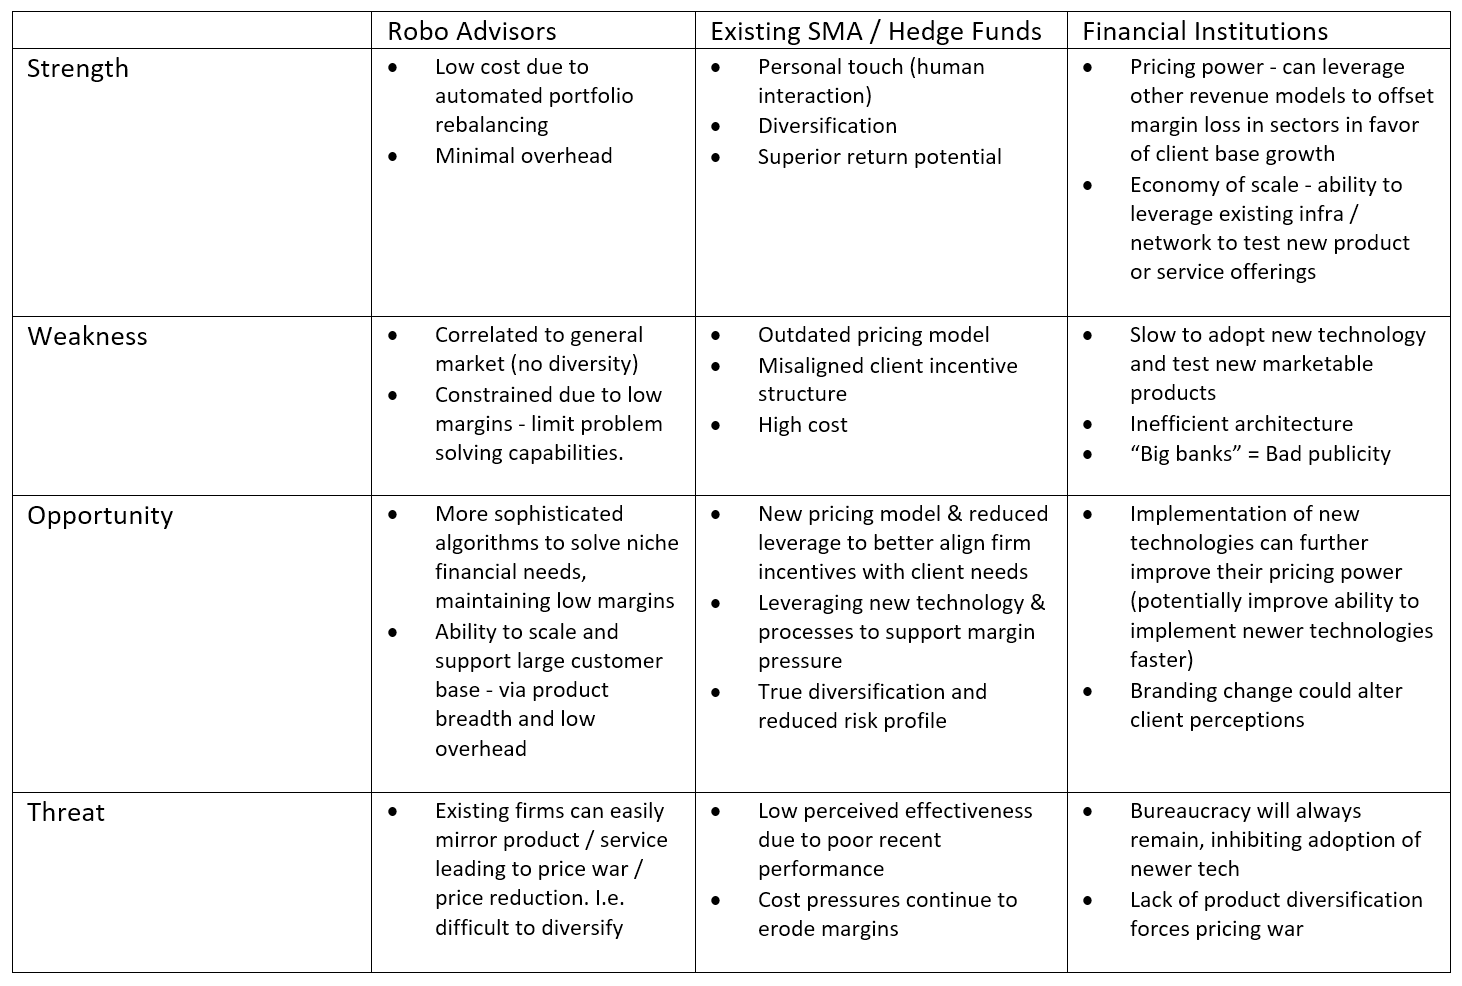
Existing business models include diversified product specialists (life insurance, annuity, etc.), traditional wealth managers (EdwardJones, Vanguard, Charles Schwab, etc.) independent wealth advisors and boutique finances houses.
-
New business models include robo-advisors, customized ETFs and third-party investment tool platforms
-
Robo advisors, while growing quickly (65% YoY), the top 11 Robo advisors still only make up $19B AUM or 0.1% of the $33 trillion investable US assets [Deloitte, Corporate Insight, 2014]
-
Portfolio overlap is rampant - Vanguard owns > 5% float in 98.2% of all US securities (FIGURE 2)
-
Total Washington State Firms – 259, up from 257 in 2013. While minimal growth, the rest of the country shows decline in small & medium firm counts. [source]
-
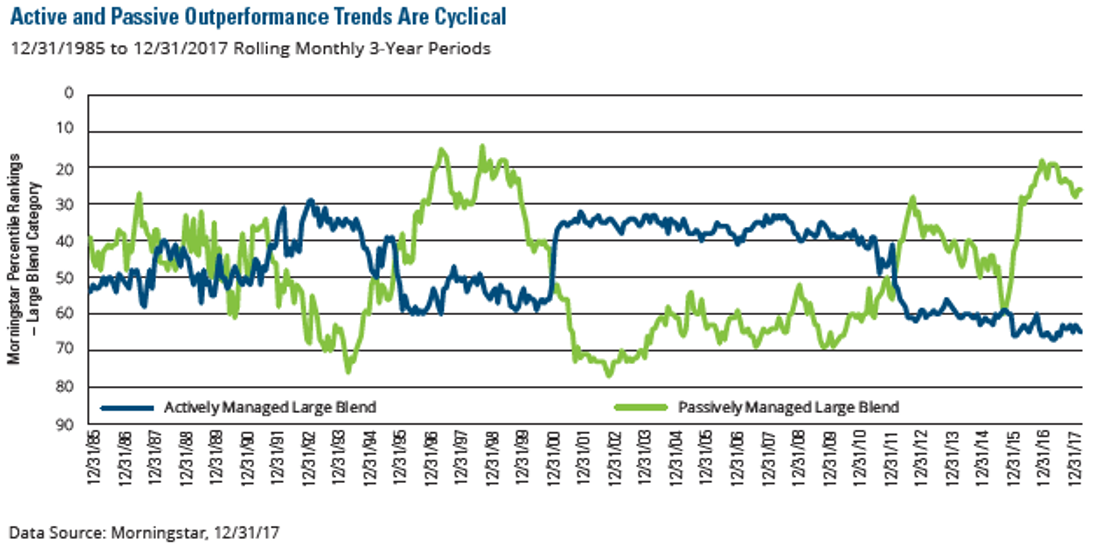
Active and passive outperformance is cyclical – in aggregate, active manager outperformed passively managed funds during an estimated 14.4 of the previous 36 years (FIGURE 3 & 6). More recently, U.S. stock-pickers’ success rate increased sharply in 2017, as 43% of active managers categorized in one of the nine segments of the U.S. Morningstar Style Box both survived and outperformed their average passive peer. [Morningstar, 2017]

-
The case against active management performance – short term capital gains, wash sales & transaction fees are the primary contributors to reduced active management performance. In fact, there is a positive correlation with active management fees and success rates; “lower-cost funds were likelier to survive and enjoyed greater odds of success”. [Morningstar, 2015]
- Passive investment outperformance is a case example of hindsight bias – literature that started the belief (average active equity fund underperforms the market portfolio over long horizons (eg Jenson (1968), Carhart (1997), Fama and French (2010), Busse et al (2014)) predates passive investment market saturation.
- First index fund (Vanguard Mutual Fund) introduced in 1976 [Bloomberg]
- “Path of least resistance” is to (1) put down active management styles (majority of market) by marketing against performance (2) reduce fees (3) follow the rest of the market to insure, not optimum returns, but that your competition is not outperforming you. Much like the airplane industry.
-
US Investible assets value: $33 Trillion [Deloitte, Corporate Insight, 2014]
-
Total US household net worth: $92.8 Trillion [source]
-
US Equity market value: $30 Trillion [source]
- Global ETF asset value: $4.569 Trillion [source]
model development takeaways & factoids:
-
Getting good data is hard – prices vary by institution and the existence of dark pools means even order book data cannot be relied upon
- Measuring your model (or portfolio manager’s) performance is really hard – if I were to tell you to pick manager, manager A who returned 12% over the last year, manager B who returned 35%, who would you pick? What If I told you A returned ~0.75% a month whereas B was in the red 15% for eleven months out of the year and made it all back in the twelfth? Has your opinion changed?
- This is the tip of the iceberg. Actively managed models need to look at slippage, relative trade performance to ensure returns per trade are performing as expected, optimum position sizes, and more.
- Broker APIs are terrible outdated – there are services which range in cost from a percentage of aum to 40k a year + a percentage of aum. I am still in the process of finding the right partner.
- Currently we connect directly to the interactive brokers api via our own api containerized and hosted on gcp
methodologies and beliefs
- Major market forces driving average increase in sector value (avg 9% per annum) are:
- Increase in capital contribution
- Currency valuation
- Inflation
- Major market forces driving day to day price fluctuations are active traders – currently still 2/3 of the market.
- The market is inefficient and ever changing.
- All models will eventually fail. To ensure long-term success models, systems, and processes that impact current or potential alpha must be:
- (1) dynamic
- (2) 100% measurable and
- (3) editable.
- All models will eventually be retired.
question checklist
The major problems that exist when trying to automate trading methods. It is imperative to have a testable, measurable process in place to continually monitor and determine success rates in the following areas:
- System architecture
- Is the system as lean as possible?
- Are we capturing all the information that we need to answer all other critical questions?
- Order execution
- Are broker(s) fees manageable?
- Are broker(s) executions timely?
- Does broker technology hinder any other critical measurement?
- Model performance (paper)
- Does the model perform well historically in and out of sample
- Does the model perform well throughout a paper trading trial
- Model performance (live)
- Does the model perform well
- Customer satisfaction
- How do you execute orders?
- What (system, script, api) do you use to execute orders?
- What broker are you using?
- What are the latencies and assumptions involved in order execution?
- Where do you buy / sell from
- Which broker(s) is (are) used?
- What do you buy / sell
- How do you determine which stock or contract to buy?
- When do you buy / sell
- How much do you buy / sell
- What are allocations based on? Portfolio makeup? Cash availability? Customer desire?
- What models are used to optimize allocations?
- How do you measure true [model / investor] performance?
- When do you start using a model (when is testing enough)?
- When do you stop using a model (when is performance undesirable?)
conclusion
Like most endeavors, you end up discovering more questions than you do answers. Some of the most difficult problems we solved had nothing to do models… it had to do with measuring success: How do you determine where to generate a buy or a sell signal? How do you determine if the buy signal was good or bad? What if it was neither? How do you improve your buy signal? How much can you improve your buy signal?
If you follow this line of reasoning, you come to the conclusion that the most profitable model – the one that can capture the most potential profit – is the one that trades the most frequently. That said, based on client and advisor feedback, the right model for the job does not always need to be the one that is the most profitable…